

I’m standing in front of a partially created process map for cleaning a major piece of equipment in the plant I’m working at. I’m writing the action the operators have just shared with me down on a sticky note. I stick it onto the map. With my back still turned to the group sitting in the conference room I say, “Great, what’s next?” After a brief hesitation one of the operators says, “Well next we go get the broomstick.” I turn around in disbelief. “Why do we need a broomstick?” The operator says, “We use the broomstick to push the start/stop switch of the conveyor belt. If we stand any closer to it then the excess product can fall off the conveyor when it starts and hit us.” In that moment I got the world of the operators’ frustration. They’d given up ever getting this problem fixed and had resorted to their own MacGyver solutions. It had been this way for nearly 20 years when I happened upon this safety concern during our process mapping session. I immediately took the concern to the Plant Manager and the work to correct the problem was completed the following week.
This incident from early in my career as a Lean Consultant highlights the magic of Process Mapping and the difference Lean Six Sigma makes when you create a safe space for people to contribute to process improvement initiatives. But what exactly is Process Mapping and how do you do it well?
What is Process Mapping
Process Mapping is a method of documenting business processes that is simple and easy to follow. Actions in a process are captured step by step and visually show how the steps are interconnected throughout an organization. They are a powerful process improvement tool for identifying improvement opportunities like process bottlenecks and waste.
The benefits of Process Mapping for businesses include:
- Documented business processes, useful for training and onboarding
- A common understanding of how long process steps are meant to take
- The opportunity to identify improvement opportunities with a Future State Process Map
- The ability to create and define metrics for monitoring process performance
- Align your business processes with the needs of your customers
- Identify and eliminate waste and process bottlenecks
- To bring clarity and definition to your business processes
Creating The Future
Process Transformation begins with capturing the Current State of the process. Also called the As-Is Process, these maps capture how things are currently working in a business process and include process bottlenecks, workarounds, re-work associated with process defects (and broomsticks). Once the Current State Process Map is developed you can begin to create the Future State (To-Be) of the process by identifying improvement opportunities including reducing process waste, streamlining the process and creating concurrent paths for certain actions. The Future State Process Map is then fulfilled by executing improvement actions to become the Current State of the new process and the foundation for future process transformations.
How to Create A Process Map
- Define the process you are going to map with clear start and end points.
- Identify and meet with your process stakeholders.
- Watch the process in action. This step is critical to creating an accurate Current State process map of how the process actually works, distinct from how it should work or how you think it works.
- Step through the process and capture each activity to create the Current State Process Map.
- Look for process improvement opportunities – reduce process waste, eliminate bottlenecks, create parallel processes, automate actions.
- Create the Future State Process Map – how the process works when all the improvements are fulfilled.
- Implement the identified improvement actions.
Secrets for Process Mapping Success
- One Action, One Sticky. Build the Current State process map one step at a time.
- Get on the court and go see the process you’re mapping in action. You will see invaluable things that are not possible to see from your office.
- Use a Parking Lot to keep your participants focused and capture improvement ideas while you’re creating the Current State Process Map.
- Make sure you involve the right people. The right people are the ones who actually work in the process day to day (not their managers). At the same time, don’t leave the managers out. What works is to be in communication with them as you develop the process maps and include their contributions.
Types of Process Maps
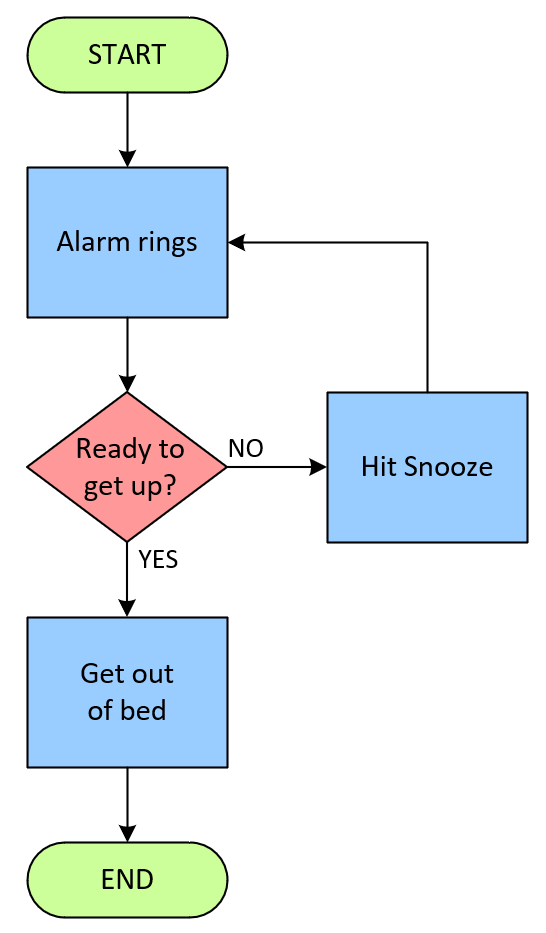
There are many kinds of process maps from the very simple to the very complex. The very simple begins with a Basic Flow Chart which follows a sequence of logic to fulfill an outcome. The example below is the process for getting out of bed in the morning.
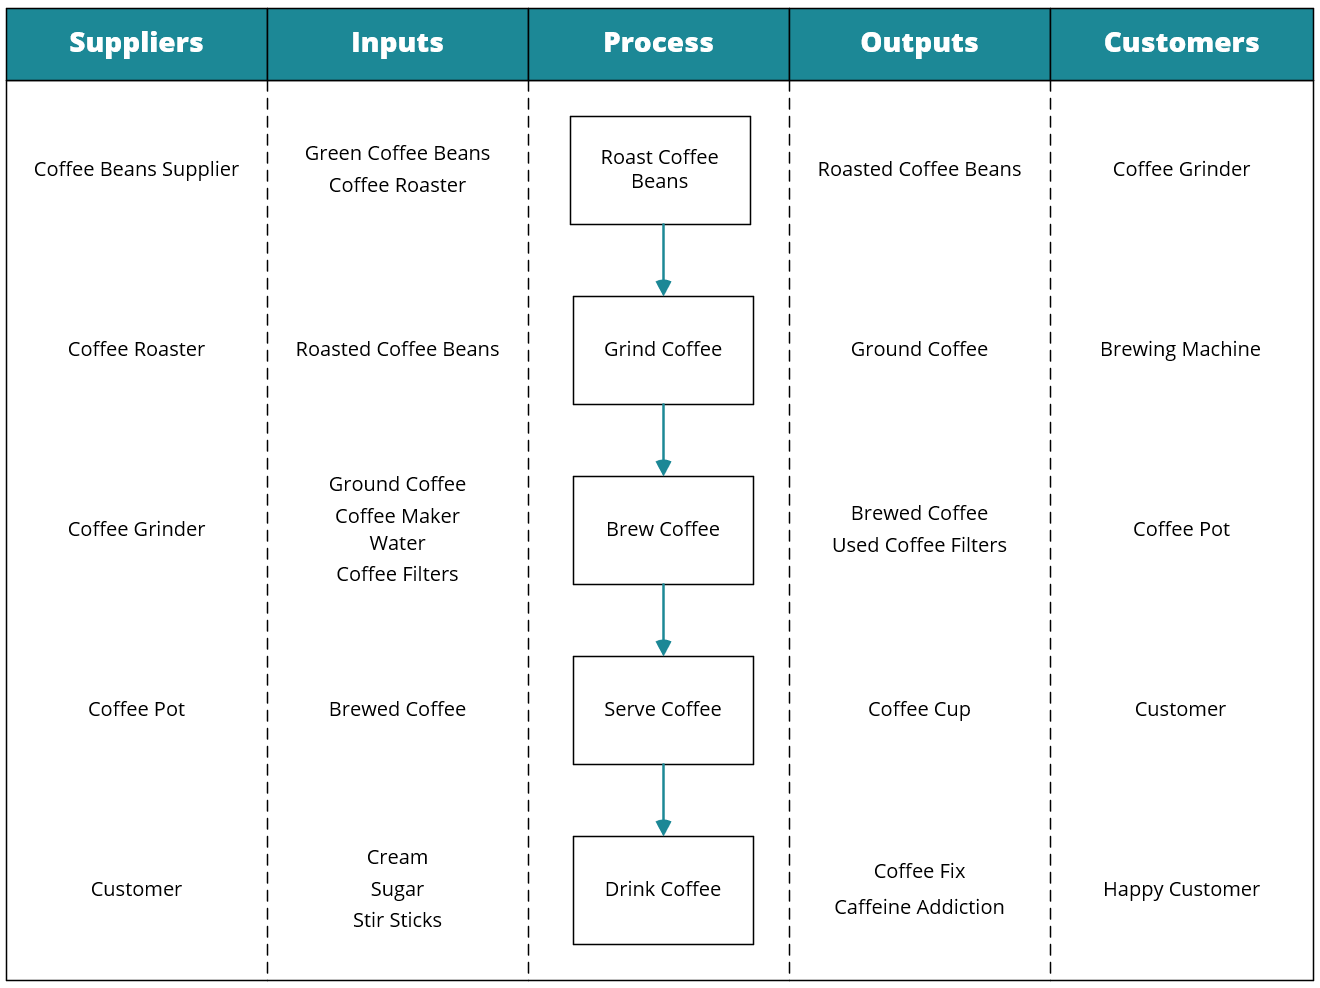
The next type of process map is called a SIPOC which stands for Suppliers, Inputs, Process, Outputs and Customers. SIPOC diagrams are great for quickly creating a high level process map that identifies the key process steps, inputs, outputs and the people involved in a whole process. SIPOC diagrams are often used at the beginning stages of a project to define the project scope. SIPOC diagrams are built by first identifying 5 to 7 key process steps, then the inputs and outputs of each step followed by the suppliers of the inputs and customers of the outputs. The SIPOC example below explains the process of making coffee.
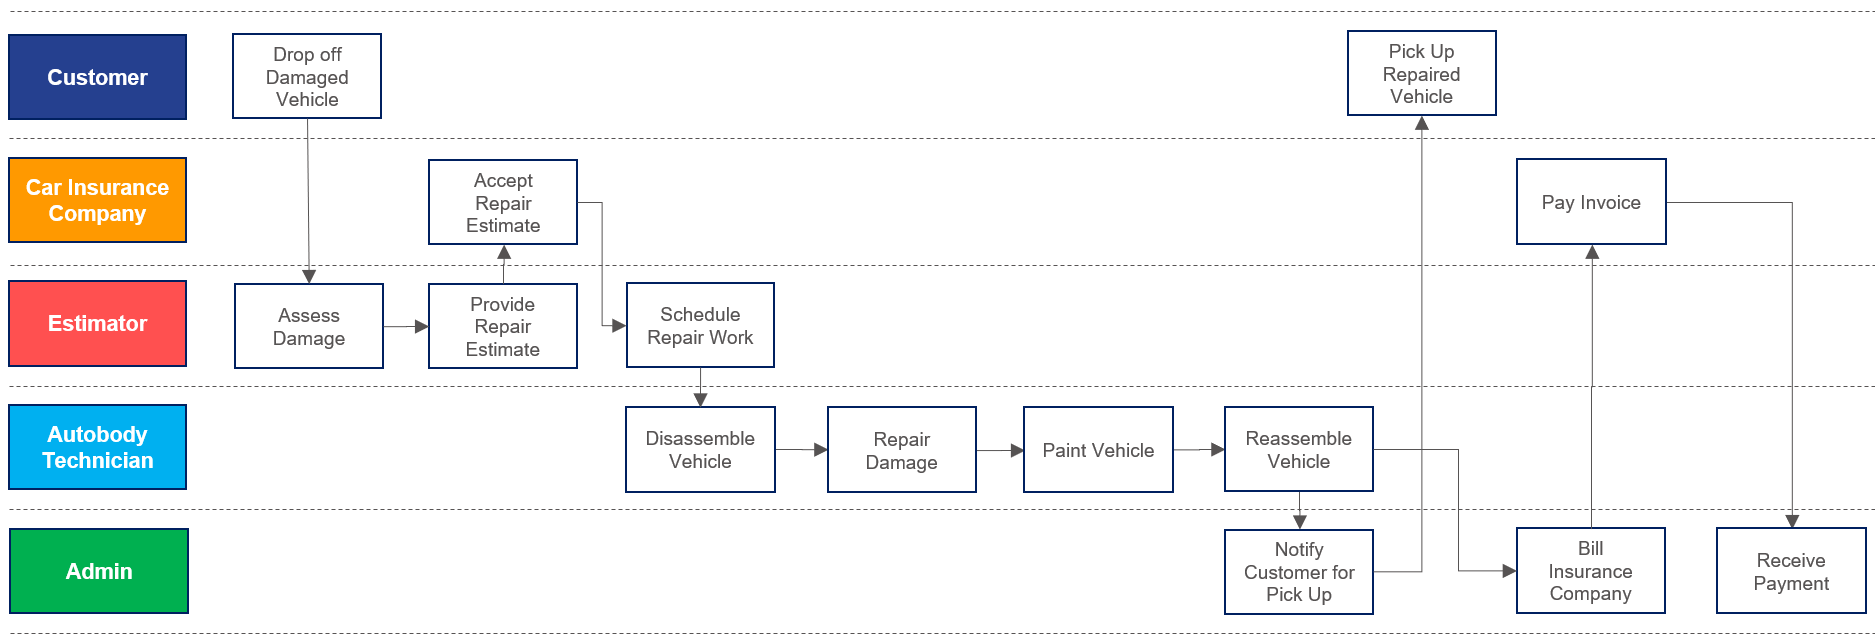
The most commonly used process map is called a Swimlane Diagram, or a Cross-Functional Diagram. Swimlane Diagrams identify each process step and the person or group who is responsible for completing each step. These diagrams are useful for processes involving multiple roles or departments with numerous handoffs between groups of people. The Swimlane Diagram below outlines the process of a customer getting their car repaired at an autobody shop.
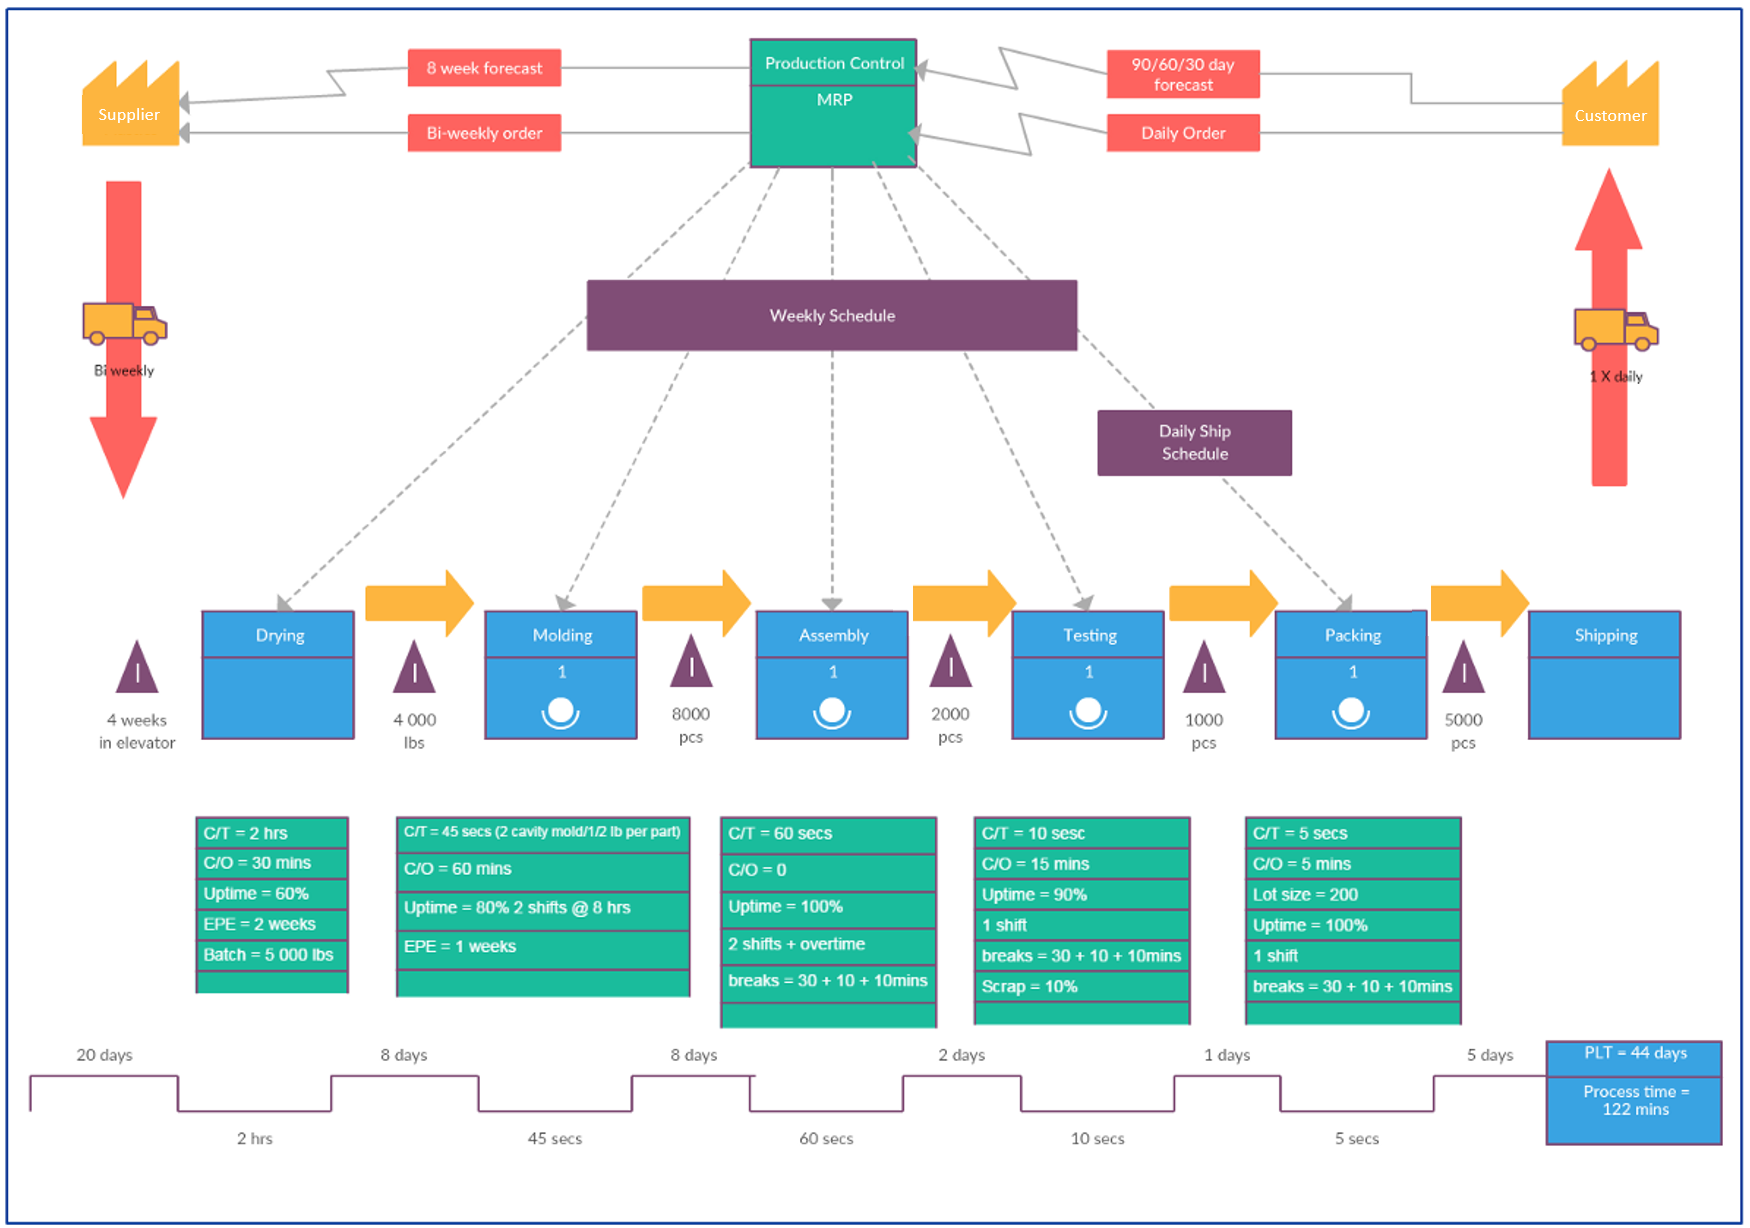
Finally, the most complex form of process map is called a Value Stream Map. Value Stream Mapping is a method of mapping, analyzing and improving the flow of materials and information to bring a product to a customer. These detailed process maps use standard symbols to create a map of work streams and information flows. Waste and non-value added activities are identified on the map as improvement opportunities. The Value Stream Map below details a plastics manufacturing process.
Curious to know what difference Process Mapping could make for your organization? Contact me to start a conversation for how Lean Six Sigma can transform the performance of your business today. I also invite you to attend my next free Lean Masterclass: 5 Simple Steps to Free Your Business from the 8 Deadly Wastes, you can register here.
Recent Comments